 System monitoring is an essential part of production deployment that can not be overlooked. NGINX is a widely-used server for load balancing and applications hosting, which provides high performance and low memory usage. However, as with any other long-running software, the good practice is to passively monitor its state to proactively detect and fix the emerging problems.
With this purpose, the NGINX team has developed Amplify – a SaaS-based monitoring tool that gathers data on the main server metrics with customizable alerts and comprehensive recommendations based on the collected data – all available within a single dashboard. With Amplify, monitoring of your NGINX-based nodes (utilized as load balancer and PHP/Ruby app server at Jelastic) is accomplished by means of the following core components:
- Alerts – to notify you when something is going wrong with the server;
- Graphs – to provide visual representation of the collected data;
- Recommendations – to receive pieces of advice based on the configuration analysis.
The NGINX Amplify tool is now available for Jelastic users as a one-click add-on. So currently, in addition to the default server stats (RAM, CPU, disk) that are provided within Jelastic dashboard out-of-box, upon the necessity you can get more advanced metrics on connections, requests, HTTP errors, HTTP version and traffic. Also, Amplify can be configured to monitor server availability and load ratio with automatic email notifications’ sending.
NGINX Amplify is absolutely free for up to 5 hosts, which makes it perfect monitoring solution for small companies and startups. So let’s get your NGINX Amplify add-on up and running as quickly as possible!
Create NGINX Amplify Account
To start with, you need to create your personal NGINX Amplify account in order to get access to the monitoring dashboard.
1. Go to the Amplify website, click Create account, enter the required data and agree to the Terms of Service. When you are finished, click Create and verify registration by following a link delivered to you via email.
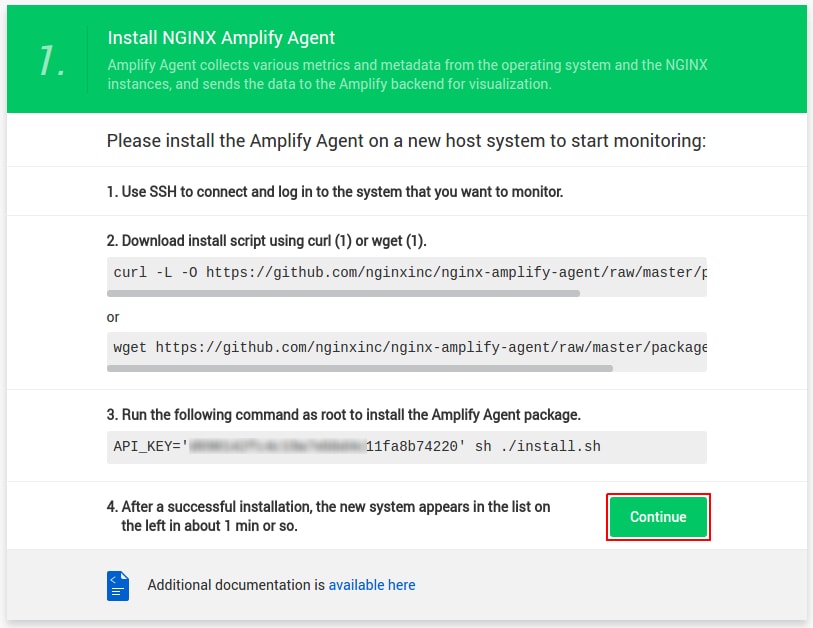
2. In the opened Install NGINX Amplify Agent page, copy and save an API key available within the third step of the procedure.
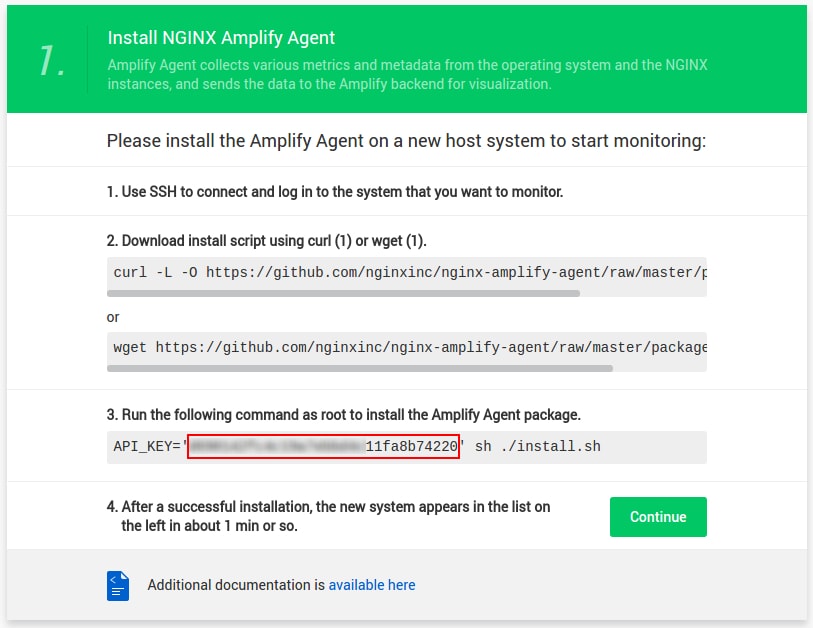
Now, you can proceed to the next section and install the NGINX Amplify add-on, using the API key you’ve just saved.
Install NGINX Amplify Add-On
The NGINX Amplify add-on can be installed on top of any environment node, based on NGINX server (i.e., load balancer or PHP / Ruby application server). If you don’t have such, create a new environment with the appropriate container and follow the next steps.
1. Click Marketplace, switch to the Add-ons tab and use the search box to find NGINX Amplify.
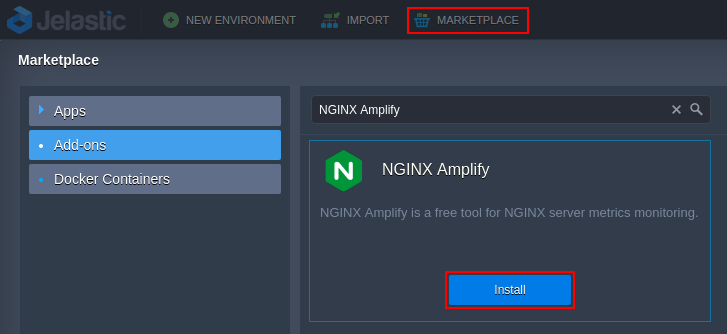
Hover over the located add-on and click Install.
2. In the installation dialog box, provide the following details:
- API key – the identifier you’ve saved from the NGINX Amplify website (if missed, can be found within the account settings);
- Environment name – an environment the add-on should be installed to;
- Nodes – a target environment layer (with either NGINX-based web server or load balancer), where add-on should be installed; herewith, all of the appropriate nodes will be adjusted.
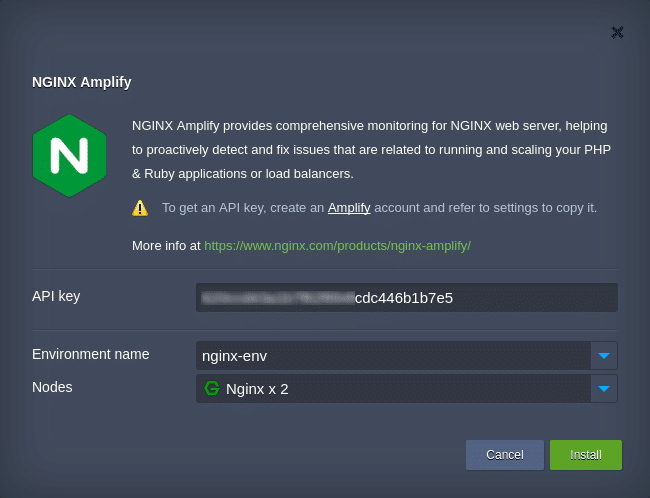
When you are finished, click Install and wait a minute for the process to complete.
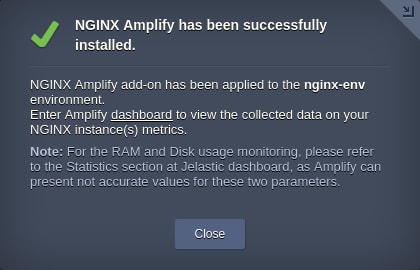
Close the successful installation dialog box and proceed to the next section in order to launch and use your monitoring dashboard.
Launch NGINX Amplify Monitoring
To start using monitoring tools that are provided by NGINX Amplify, perform the following simple steps.
1. Come back to the Install NGINX Amplify Agent page (the one from which you saved your API key) and click Continue.
2. Wait a minute for Amplify to collect the data on the appropriate NGINX instance(s) parameters from within the target environment. When the process is completed, you’ll be shown a dialog box with suggestions on the required NGINX configurations to make the metrics visualization possible.
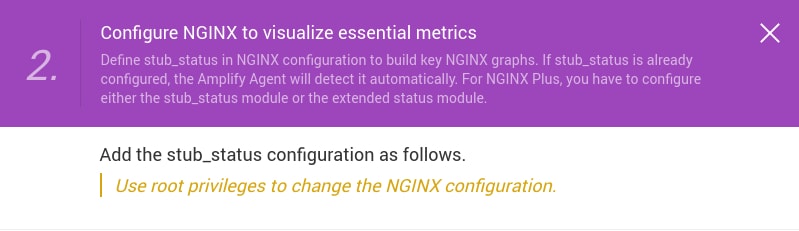
However, since this configuration was already applied during the add-on installation, the Amplify Agent will detect it automatically. Thus, you can just skip this step by clicking Continue at the bottom of the frame.
3. When metrics are collected, you’ll see a dialog box, suggesting to set up additional NGINX metrics that will enable you to get more comprehensive analysis of the app performance.
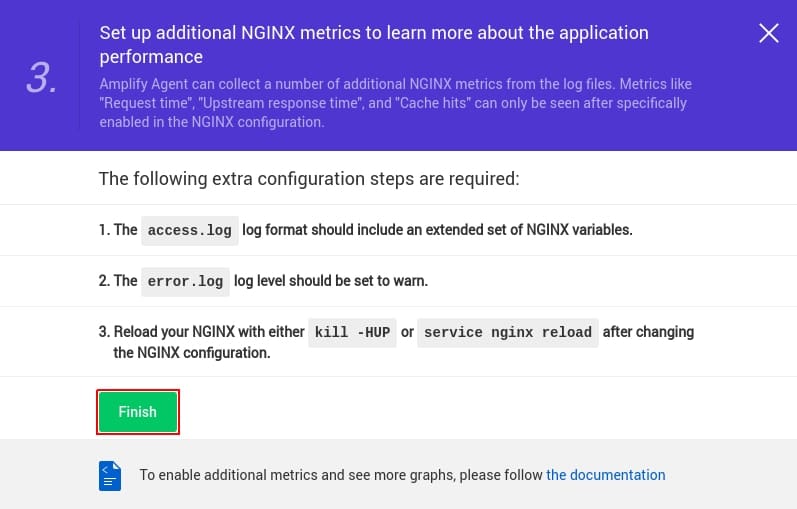
You can enable some optional NGINX metrics, such as Request time or Cache hits by following the documentation. To complete the installation process, click Finish.
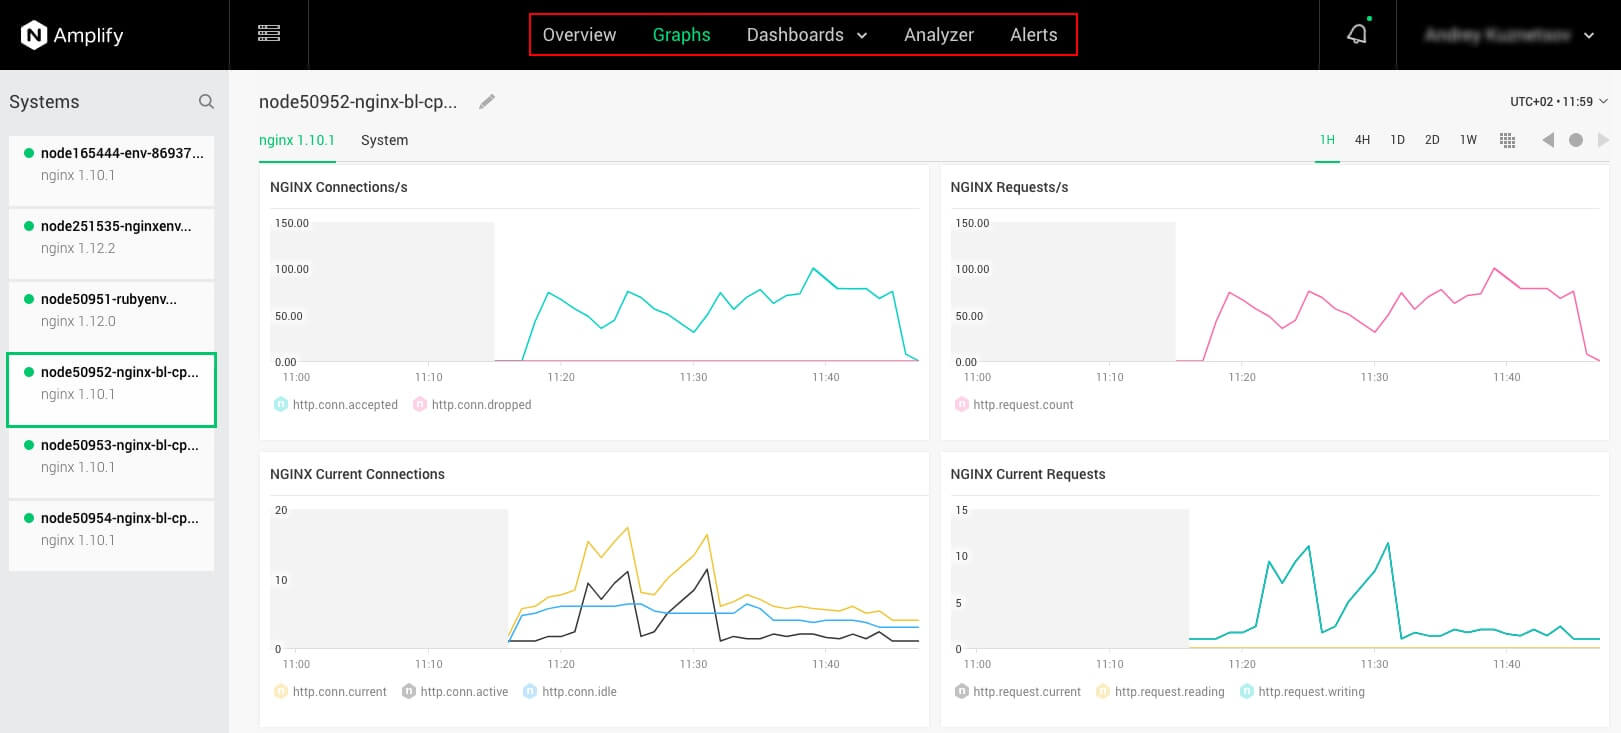
That’s all! Now, you can see the detailed information on your servers using the appropriate tabs at the top of a page (but please remember – statistics on CPU, RAM, and Disk usage should be viewed via Jelastic dashboard to get the proper consumption values):
- Overview – provides general information on instance (application health score, total requests, etc.);
- Graphs – visualizes various metrics usage (connections, requests, errors, protocol preferences, etc.);
- Dashboards – allows creating a custom dashboard, which will show only required information;
- Analyzer – gathers all data on your servers and sorts it across the appropriate tabs (Build, Static analysis, Virtual servers, Security advisories and SSL – click a particular one to find out the respective metric details and recommendations);
- Alerts – configures alerts based on a specific metric monitoring (the appropriate email notification will be sent to the specified subscribers).
This way, you can monitor your installation and proactively detect and fix issues related to running and scaling NGINX-based applications. You may refer to the detailed documentation of NGINX Amplify if you need to configure advanced monitoring parameters.
Give it a try – install Amplify add-on and enhance monitoring of your NGINX instance(s) hosted in Jelastic PaaS.