Horizontal scaling (adding several servers to the cluster) is commonly used to improve performance and provide high availability (HA). The important advantage is that it lets increase capacity on the fly and gives more freedom to grow. But at the same time, it requires the application to be carefully designed so that it is synchronized on all instances in the cloud. Jelastic PaaS tries to ease this process as much as possible for admins not to waste time on re-configurations.
Below, we’ll overview general specifics and benefits of horizontal scaling in Jelastic PaaS and go step-by-step through the process of setting triggers for automatic horizontal scaling.
Horizontal Scaling Peculiarities
Horizontal scaling is the process of changing the number of nodes within a single layer. Herewith, Jelastic PaaS automatically ensures the following benefits, while utilizing this feature (applicable for both automatic and manual scaling).
Selectable Scaling Mode
The preferred scaling mode for a node group can be selected during a new environment creation, as well as adjusted at any moment for existing environments through the topology wizard:
- Stateless – simultaneously create new nodes from the base image template;
- Stateful – sequentially copy the file system of the master container into new nodes.
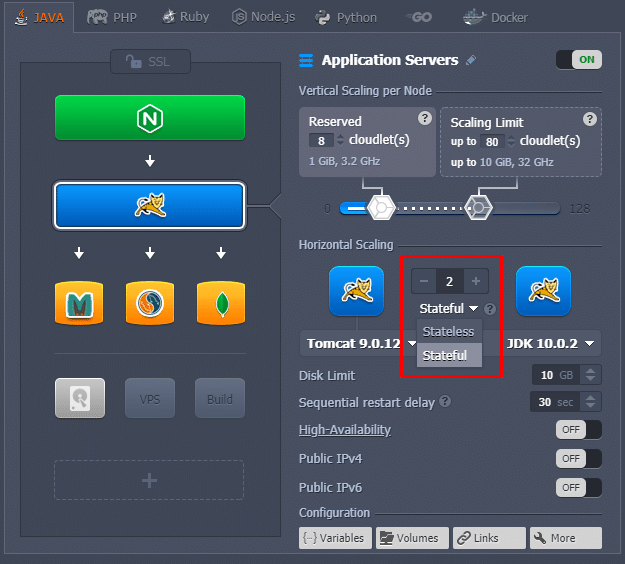
The first option is comparatively faster, while the second one automatically copies all custom configurations (e.g., deployments or Custom SSL).
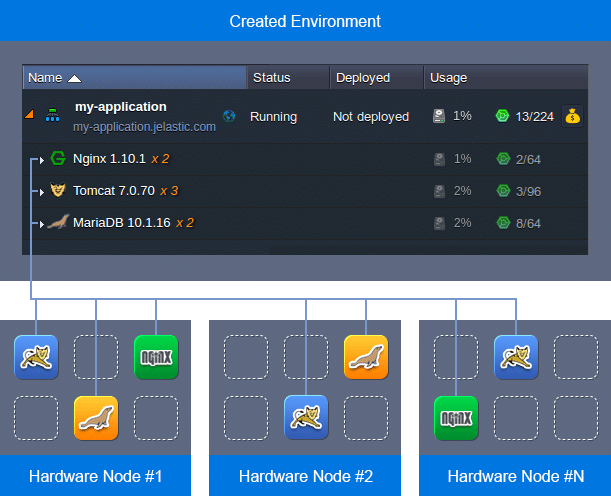
Anti-Affinity Rules
All newly added containers of the single layer are created at different hardware nodes, providing advanced high-availability and failover protection.
Nodes Mass Management
Having several same-type nodes within a layer enables their synchronous management. Thus, all comprised containers can be configured simultaneously through the corresponding icons: inspected for logs and statistics, accessed via Web SSH, restarted or redeployed, etc.
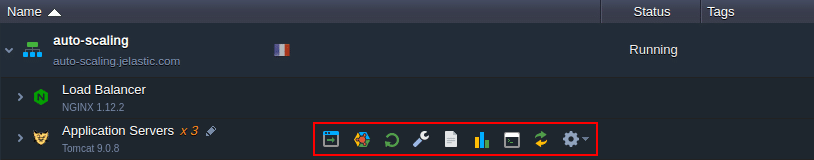
Herewith, if needed a list can be expanded to operate each particular node separately.
Automatic Horizontal Scaling Based On Triggers
The implementation of automatic horizontal scaling is performed based on the nodes current resource consumption, which is monitored through the tunable triggers. You can adjust the scaling conditions due to your needs, i.e., the lower/upper limit (percentage) for the resource consumption and a time frame the load should stay under/above it for the nodes removal/addition.
There are five different types of resources, which are monitored by triggers:
- CPU;
- Memory (RAM);
- Network;
- Disk I/O;
- Disk IOPS.
The trigger starts monitoring the resource consumption immediately after addition, and when the usage level exceeds the stated limit, a trigger becomes invoked. Subsequently, if the percentage of consumed resources stays out of the specified limit for a defined period, it will be executed, adjusting the number of nodes.
To configure a trigger for automatic horizontal scaling, follow the next steps:
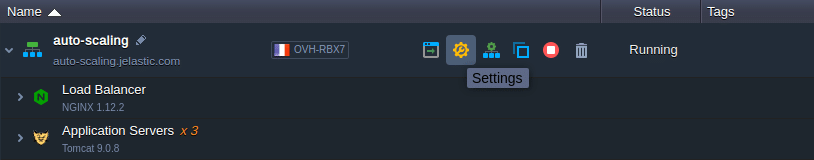
1. Click the Settings button for the desired environment.
2. In the opened tab, navigate to the Monitoring > Auto Horizontal Scaling section. Here, you can see the list of all triggers configured for the environment (if any).
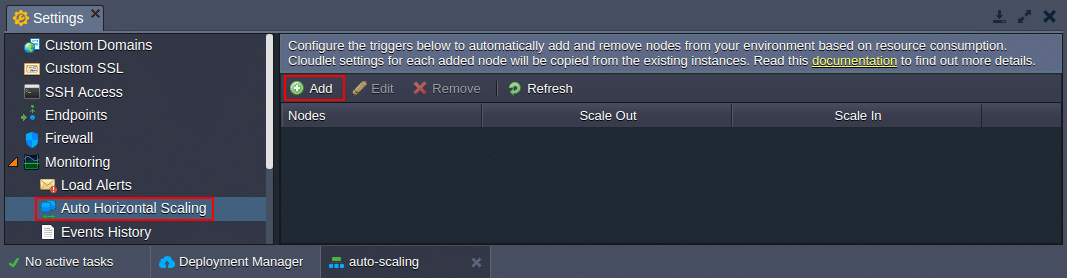
Click Add to configure a new scaling condition.
3. Select the required environment layer (if multiple environments are available), switch to the tab with the resource type to be monitored, and tune the Add/Remove Nodes trigger conditions.
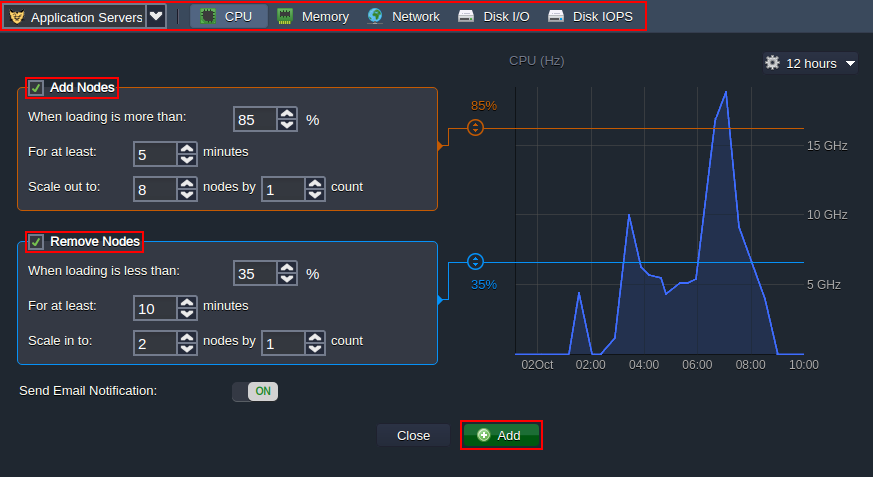
Click Add at the bottom to configure a new trigger.
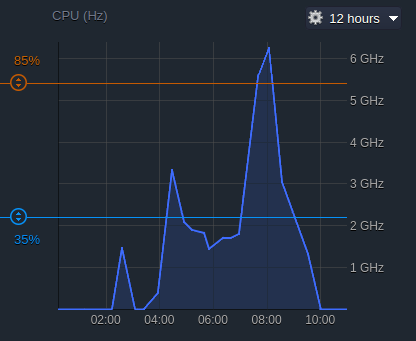
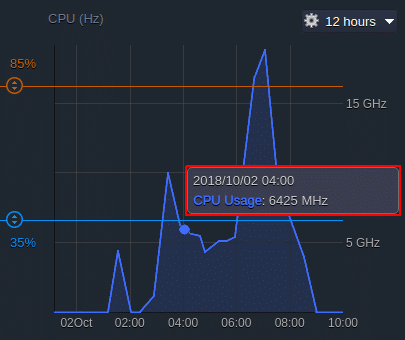
4. In the right part of the section, you can see the graph which shows the statistics of the chosen resource consumption.
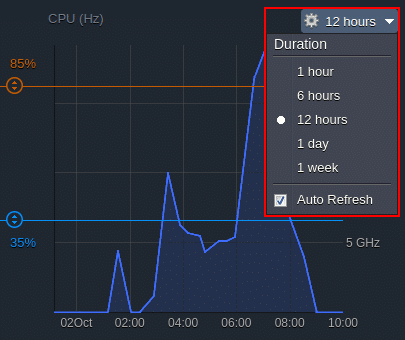
It stores and displays information of the application’s performance for the last week. You can choose an exact duration you are interested in using the drop-down list above the graph. Also, here you can enable/disable the statistics’ Auto Refresh function.
5. Hover over a particular point of the graph to see the exact amount of resource consumption for the chosen moment of time. This information can be used for setting proper conditions for the execution of the trigger.
6. Each trigger has two options (i.e., Add and Remove Nodes), which can be enabled with the corresponding check-boxes right before the title.
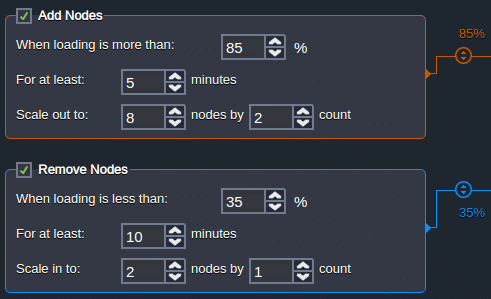
When enabled, each of them can be configured in a similar way using the following options:
- Whenever loading is more (less) than – the upper (lower) trigger limit in percentage (or Mbps for Network), based on which it will be invoked (also, you can state the required magnitude with the help of the appropriate sliders to the right);
- For at least – the number of minutes (up to one hour with a 5 minutes step, i.e., 1, 5, 10, 15, etc.) a trigger should remain invoked before alteration of the nodes’ count;
- Scale out (in) to – the maximum (minimum) number of application server nodes that can be stated within the application server layer due to automatic horizontal scaling;
- Scale by – the count of nodes that are to be added/removed at a time upon trigger execution.
7. As an addition, Jelastic PaaS gives you the possibility to receive email notifications on horizontal scaling events. This option is enabled by default but you can disable it using the appropriate Send Email Notifications switcher.

If enabled, you will receive an email message every time the trigger is executed with the detailed information on the Reason and Result of the automatic scaling.
8. While editing an existing trigger, you can Apply the changes, Undo Changes to restore the previous trigger state or Close to exit without any changes.

9. Consequently, you can track the triggers execution through the appropriate environment Settings > Monitoring > Events History section by selecting the Horizontal Scaling type within Filters.
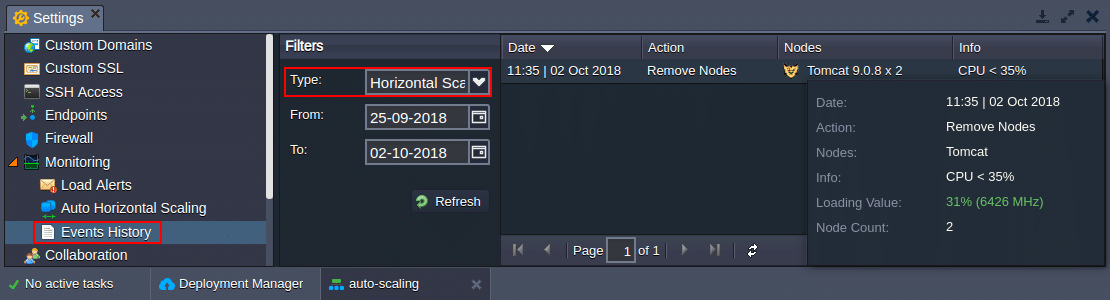
Hover over the particular record to get additional information within the pop-up frame.
That’s it! Now you know how to configure a set of horizontal scaling triggers and track their execution in order not to worry about your application performance, as well as not to overpay for unused resources. Get started for free at our Jelastic PaaS platform.